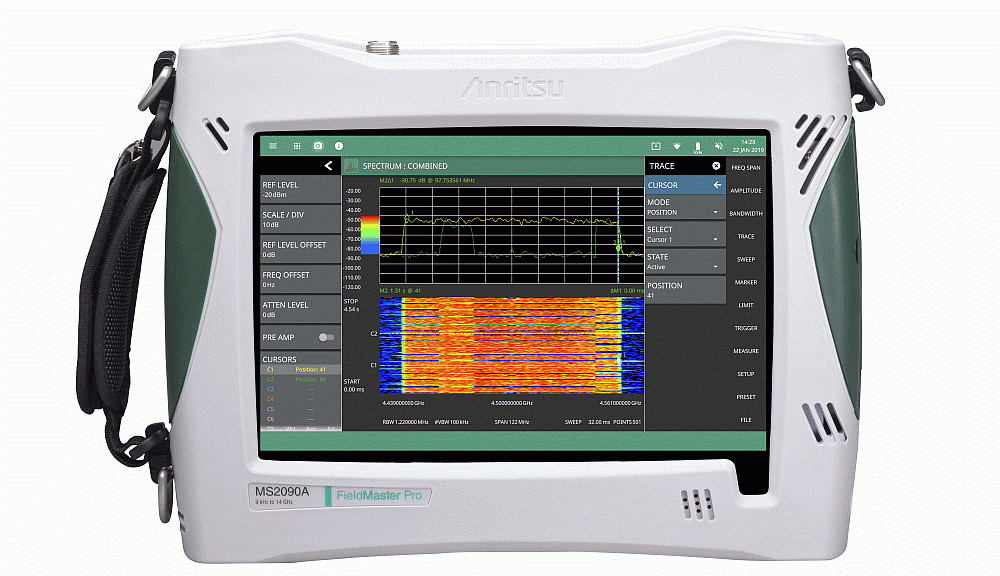
- Anritsu announces the Field Master Pro MS2090A portable spectrum analyzer with touch screen for field measurement applications.
- With frequency coverage up to 54 GHz and real-time spectrum analysis bandwidth up to 100 MHz, this instrument has been designed to meet the testing requirements of the latest generation of wireless communications: 5G telecommunications, radio broadcasting, standards compliance, satellite systems, radars, etc.
- The Field Master Pro MS2090A portable spectrum analyzer range includes seven models with frequency coverage from 9 kHz to 9/14/20/26.5/32/44 and 54 GHz.
Designed for easy field use, these portable instruments are equipped with durable rubber moulds to protect the connectors from rain. They are equipped with a 10 inch colour touch screen (resolution 1280 x 800). Touch control allows you to navigate within the frequency range of a simple screen scan, or zoom in/out with finger movements.
These instruments have a Displayed Average Noise Level (DANL) of less than -160 dBm/Hz and a typical Third-Order Intercept Point (TOI) of +20 dBm, in order to optimize the search for spectral interference sources, point-to-point radio alignment and harmonic and distortion measurements.
With a modulation analysis bandwidth of 100 MHz, as well as phase noise, typically -110 dBc/Hz @ 100 kHz offset, these analysers are suitable for modulation measurements on digital communications systems.
Measurements of transmitter power and low disturbance signals can be made with an amplitude accuracy of ±0.5 dB (typical).
The Field Master Pro MS2090A analyzer supports 5G NR (New Radio) demodulation, as well as decoded Cell ID, Beam ID, RSRP/RSRQ, SINR and EVM information over all 5G bands (below 6GHz[3.5GHz] and millimeter frequencies[28GHz and 39GHz]).
The portable instrument can also be used for compliance tests, including EIRP, spectral emission mask and time offset, as well as harmonics and transient tests.
Its real-time spectrum analysis function up to 100 MHz band makes it possible to monitor interference in cellular telecommunications frequency bands or in ISM bands.
The spectrogram display function allows spectrum monitoring and the location of continuous or intermittent interference signals. Six tracks can be individually configured to display Clear/Write, Max Hold or Min Hold measurements, average among others. The MS2090A analyzer can also be combined with the 3D RF signal coverage mapping solution with NEON Signal Mapper MA8100A software in both indoor and outdoor environments.


