
- Frequency response analysis of equipment under test, using Bode plots, is now possible with some ranges of Rohde & Schwarz oscilloscopes.
- A software option makes it possible to analyse the response to frequency variations between 10 Hz and 25 MHz without the need for an additional instrument.
This option for frequency response analysis is available for R&S RTB2000, R&S RTM3000 and R&S RTA4000 oscilloscopes from Rohde & Schwarz.
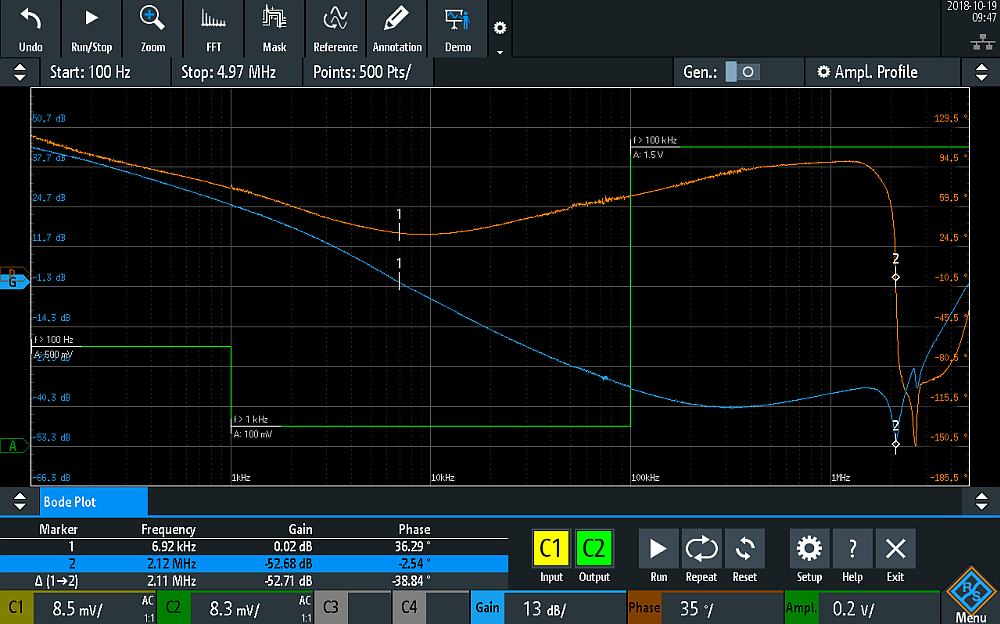
With the R&S RTx-K36 option, oscilloscopes offer simultaneous display of Bode diagrams for phase and gain as a function of frequency.
Vector network analyzers used for measuring the response of a control loop and the PSRRR (power supply rejection ratio), or for characterizing passive components, generally do not cover frequencies below 9 kHz and require a much higher investment than an oscilloscope. According to Rohde & Schwarz, it is now possible, with the R&S RTB2000 entry-level oscilloscope, to perform frequency response measurements from 10 Hz at a very attractive price.
In addition to the traditional time domain measurements that can be performed with oscilloscopes, the R&S RTB2000, R&S RTM3000 and R&S RTA4000, equipped with 10-bit ADCs, can also perform gain and phase frequency response analyses.
The R&S RTx-K36 option (Bode plot) is available from Rohde & Schwarz and some of its distributors.
This software option is available at a price of €490 for an R&S RTB2000 oscilloscope.